Syllabus Map
- Study map: Syllabus Study Map
Overview
- Metrics define what “good” means for your model.
- Different tasks and error costs require different metrics.
- Always combine summary scores with error diagnostics.
Classification Metrics
Accuracy
- Formula: .
- Best when classes are balanced.
- Can be misleading under class imbalance.
- When to use: balanced-class problems where FP and FN have similar cost.
Precision
- Formula: .
- Answers: how many predicted positives are correct.
- Prioritize when false positives are costly.
- When to use: spam detection, fraud alerts, or moderation systems where false alarms are expensive.
Recall
- Formula: .
- Answers: how many true positives were found.
- Prioritize when false negatives are costly.
- When to use: medical screening, safety monitoring, or anomaly detection where misses are expensive.
F1-score
- Formula: .
- Balances precision and recall.
- Useful when one metric alone is insufficient.
- When to use: imbalanced classification when you need one score that balances FP and FN.
Balanced Accuracy
- Formula: .
- Better for unequal class sizes.
- Equivalent to mean recall across classes in binary settings.
- When to use: imbalanced binary tasks where standard accuracy would overstate majority-class performance.
Macro vs Micro Averaging
- Macro: average per class, treating classes equally.
- Micro: aggregate counts globally, weighting by class frequency.
- Use macro when minority classes matter more.
- When to use macro: multi-class settings where each class should contribute equally.
- When to use micro: multi-class settings where overall instance-level performance is the priority.
Diagnostic Tools
Confusion Matrix
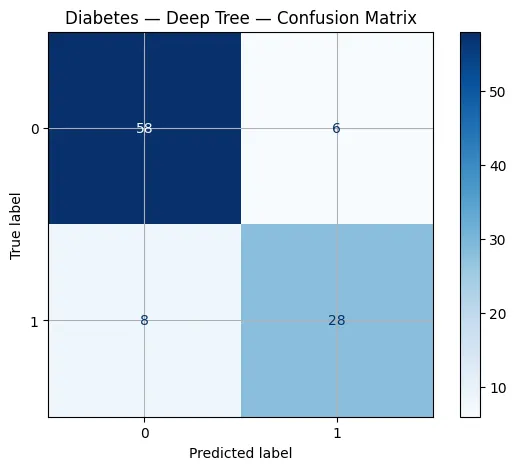
- Shows TP, FP, TN, and FN structure directly.
- Makes specific failure types visible.
- Helps identify systematic class confusions.
ROC Curve and AUC
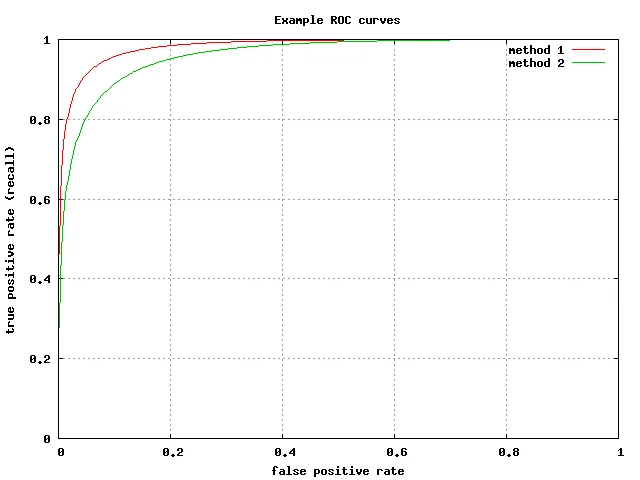
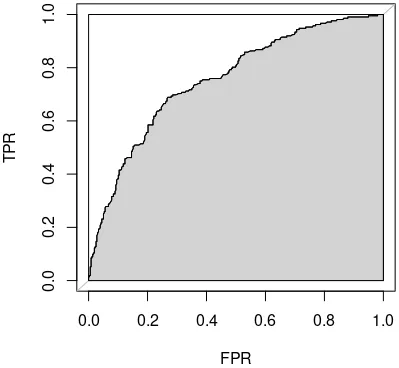
- ROC plots TPR vs FPR across thresholds.
- AUC summarizes threshold-free ranking quality.
- Useful for comparing classifiers with varying thresholds.
PR Curve
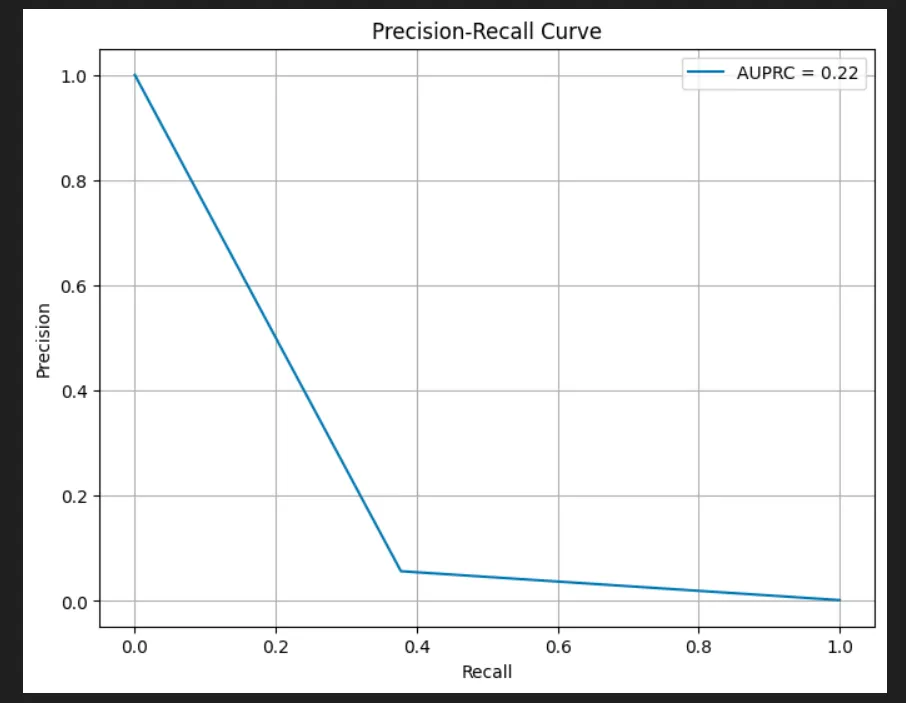
- Plots precision vs recall across thresholds.
- Often more informative than ROC under heavy imbalance.
- Focuses on positive-class performance.
Calibration
- Reliability diagrams and Brier score check probability quality.
- A well-calibrated model’s predicted probabilities match observed frequencies.
Regression Metrics
MSE
- Formula: .
- Penalizes large errors heavily.
- Common for optimization due to smooth gradients.
MAE
- Formula: .
- More robust to outliers than MSE.
- Interpretable in target units.
- Formula: .
- Measures variance explained by the model.
- Can be negative if performance is worse than mean prediction.
MAPE
- Formula: .
- Gives percentage error.
- Avoid when true values are near zero.